01 / GIS + everyday data cleanup
A messy spreadsheet. A usable map.
Standardize names, remove duplicates, and flag locations that need a human check.
| Facility | Category | Check |
|---|
Tillotson
Spatial Systems
Start a Project
Software + Automation
Clean a spreadsheet. See what a storm could affect. Build a briefing. Watch the work happen below—or try it yourself.
01 / GIS + everyday data cleanup
Standardize names, remove duplicates, and flag locations that need a human check.
| Facility | Category | Check |
|---|
02 / Weather + emergency management
Move the sample storm. Watch the map and facility list change together.
03 / Reporting + office automation
Choose a sample scenario. Get a map, a facility list, and a plain-language summary in one document.
Your inputs
Facility spreadsheetCleaned locations from demo 01
Sample storm areaThe same analysis as demo 02
Report templateA consistent format for every run
A complete sample is ready to read.
Download opens as a standalone HTML report. Choose “Save as PDF” in your browser’s print dialog for a PDF.
What This Looks Like
The goal is not to impress people with code. The goal is to reduce manual effort, make results easier to repeat, and give decision makers outputs they can understand without becoming GIS or programming experts.
Ways to Use Code
These can be scoped as a small script, a polished internal tool, a repeatable report, or a modernization project for an older workflow.
Automation
Automate repetitive data preparation, GIS processing, map exports, file organization, QA checks, and report generation.
GIS Tools
Build script tools, toolboxes, and add-in style workflows that fit into how GIS teams already work.
Modernization
Move older ArcMap, Python 2, or fragile desktop workflows toward ArcGIS Pro, Python 3, clearer packaging, and better documentation.
Dashboards
Turn analysis results into charts, webmaps, simple dashboards, and PDF-ready visuals that support decisions.
More Technical Work
Explore land-cover analysis with public data and a completed open-source GIS modernization. These examples show how custom tools turn data into useful reports and keep established workflows working in current software.
Remote Sensing + R
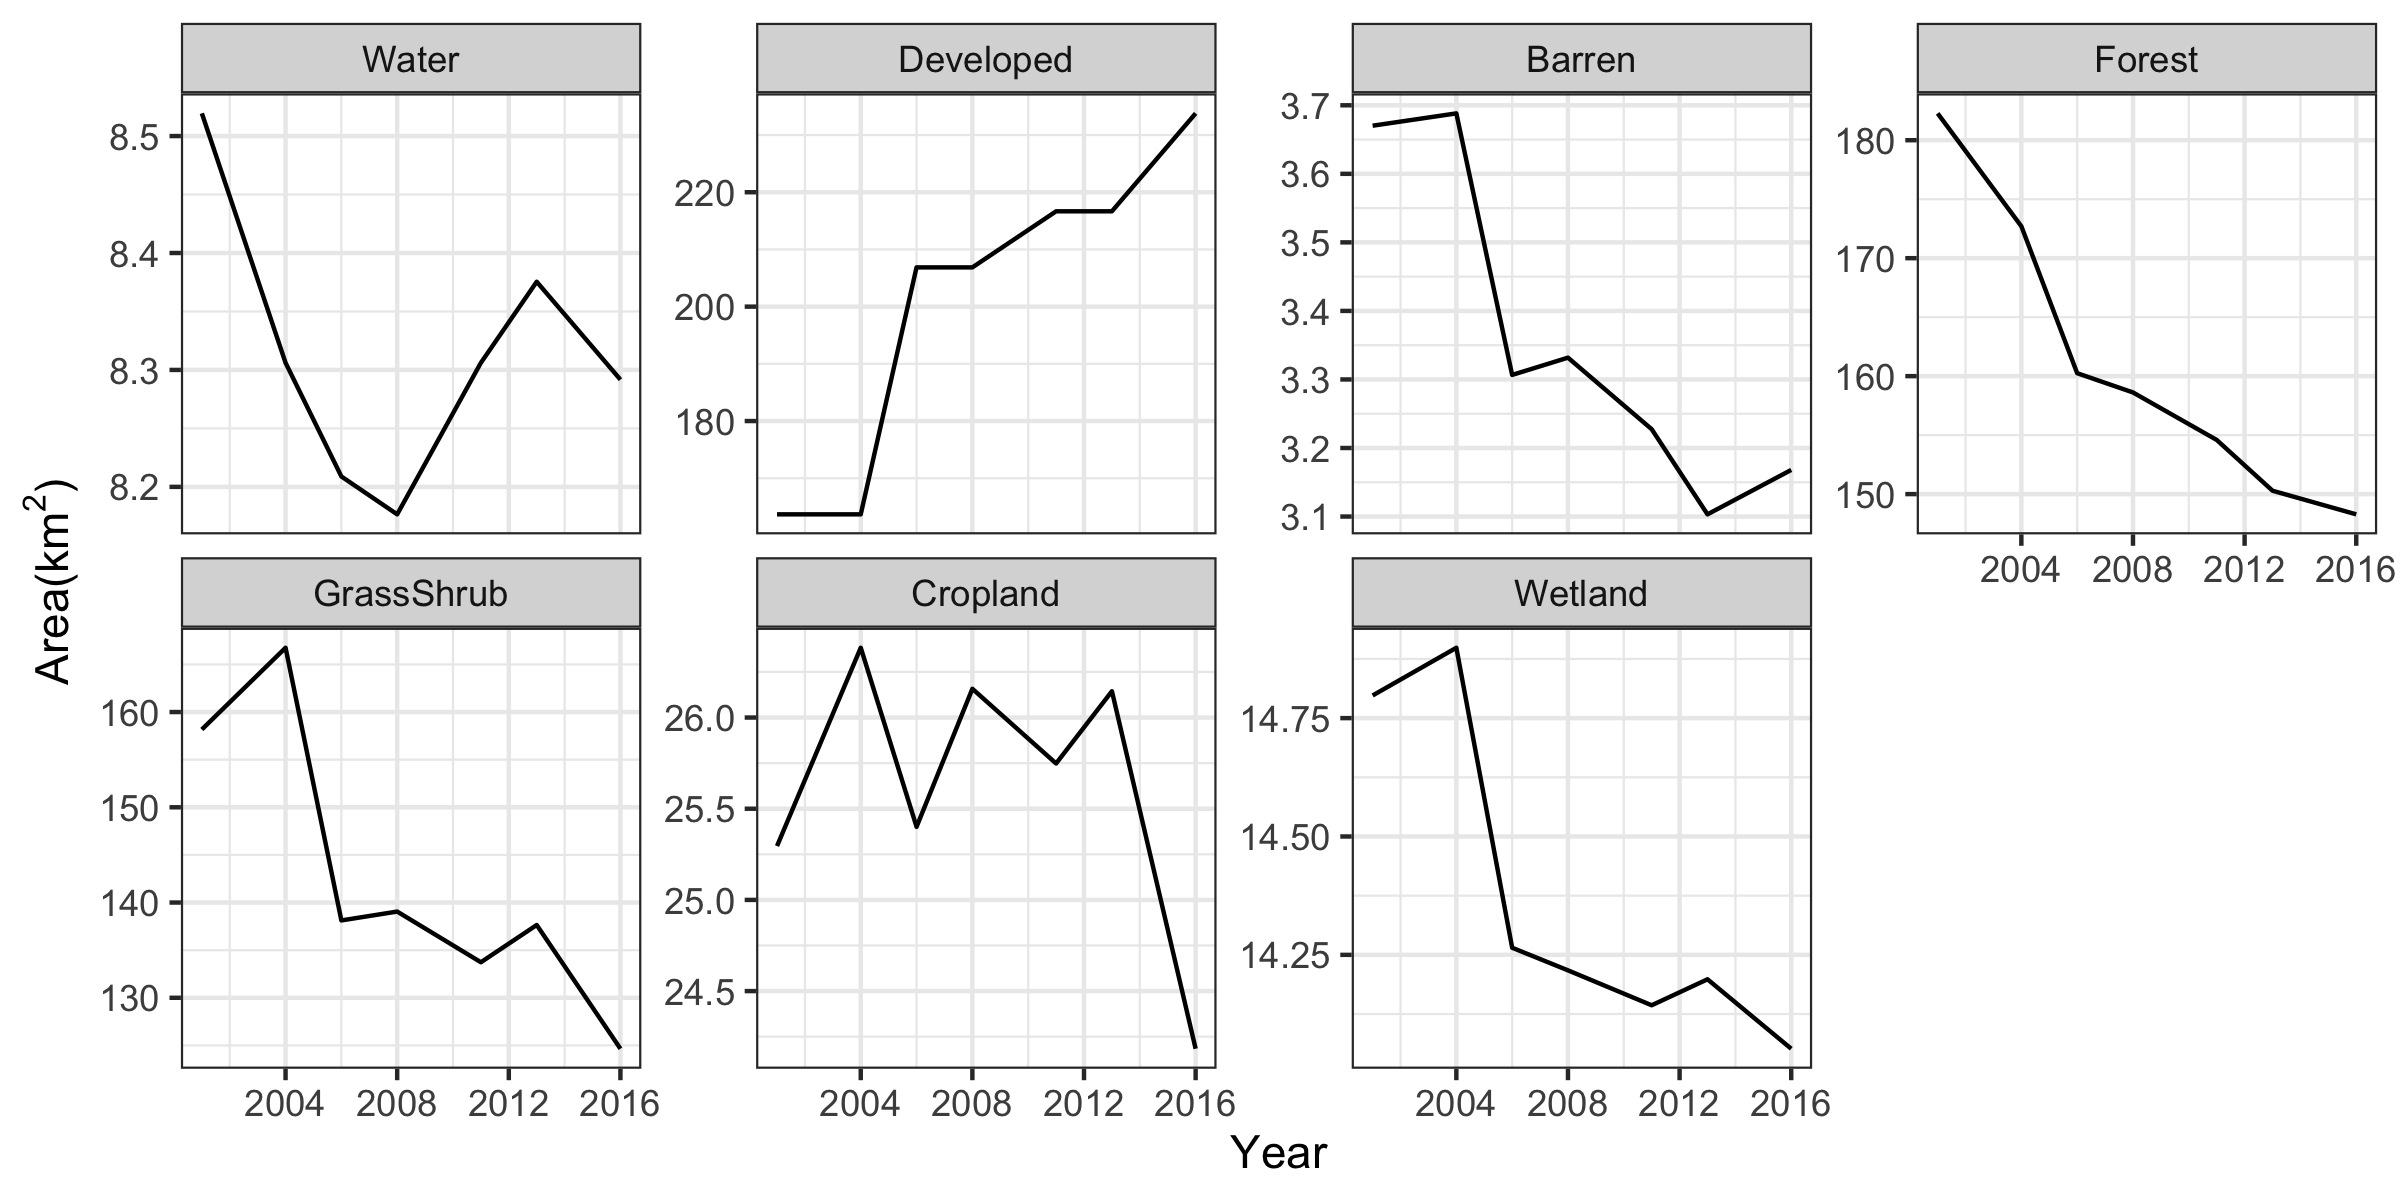
A repeatable raster workflow classified NLCD imagery across multiple years, summarized land-cover area, and produced charts that make long-term landscape change easier to review.
Change Detection
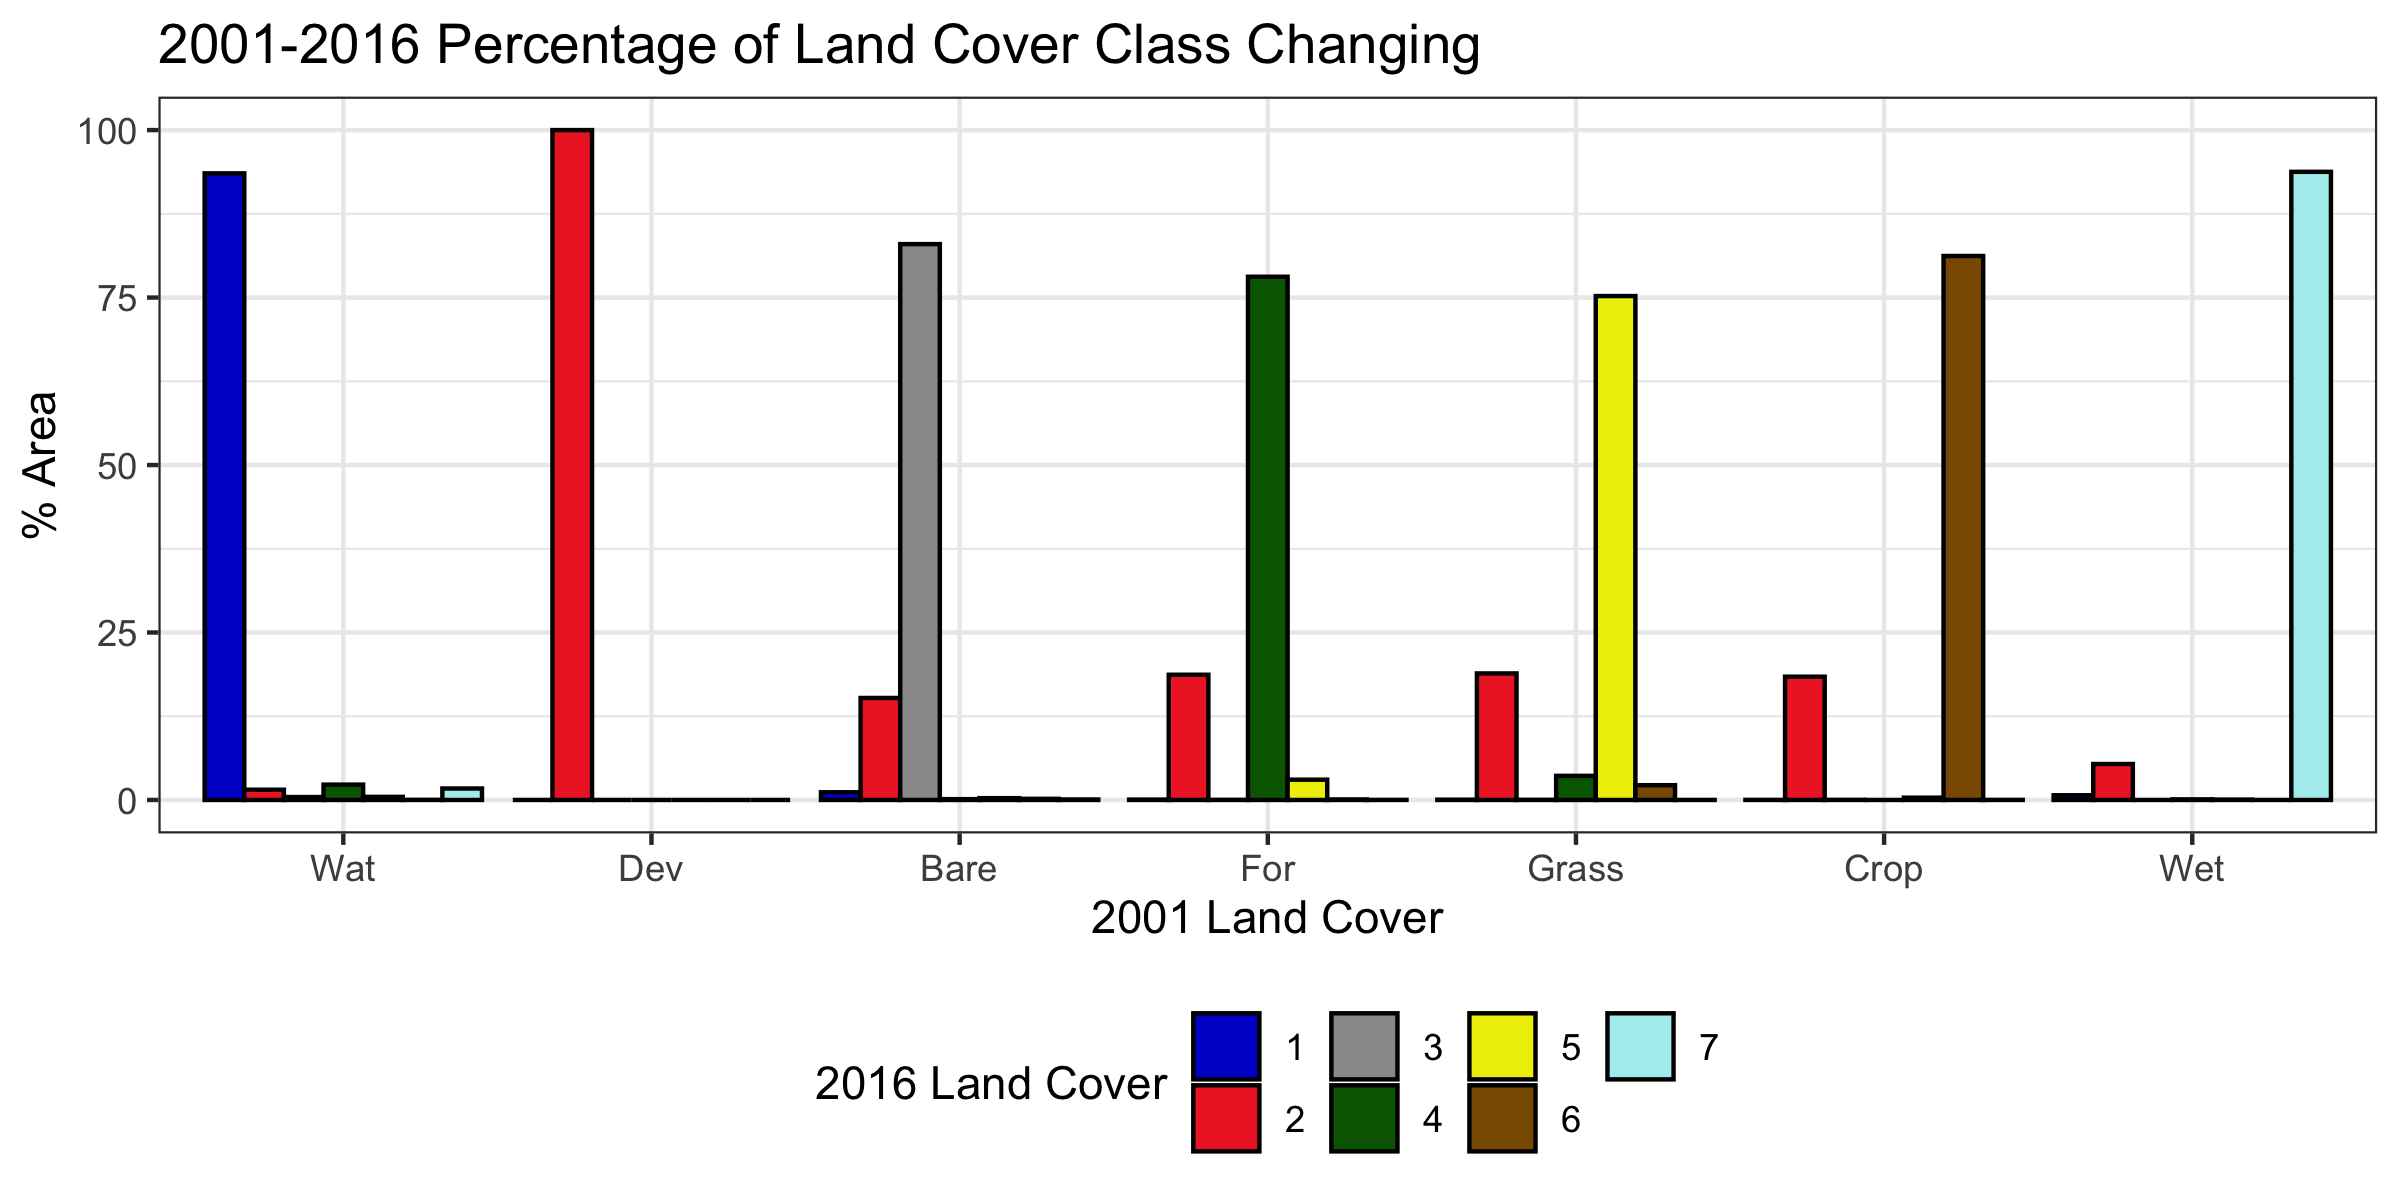
Instead of only asking what changed overall, the workflow compared earlier and later land-cover classes to show which categories converted into other categories.
ArcMap + Python 2
deprecated ArcPy calls
manual install notes
to
ArcGIS Pro + Python 3
updated imports + errors
documented toolbox package
Completed Python + ArcGIS Pro Port
Modernized the open-source SPreAD-GIS environmental sound-propagation model from ArcMap and Python 2.7 to ArcGIS Pro and Python 3 while preserving its GPL licensing and established model workflow.
Project Process
Start with the work you need to complete, the data you have, and the result you need. The project can then be scoped around your software, staff, and reporting requirements.
Review the current steps, inputs, and outputs to agree on what the tool needs to do.
Develop a script, GIS tool, or reporting workflow that fits how your team works.
Check results against agreed examples and test how the tool handles incomplete or unexpected data.
Provide setup instructions, usage notes, and a walkthrough so your team can run the workflow again.
Have a Repetitive Task?
Send the task, the files involved, and what the final output should look like. Even a messy manual workflow can often become a cleaner tool.