
Live Webmap Demo
Watch land cover change over time.
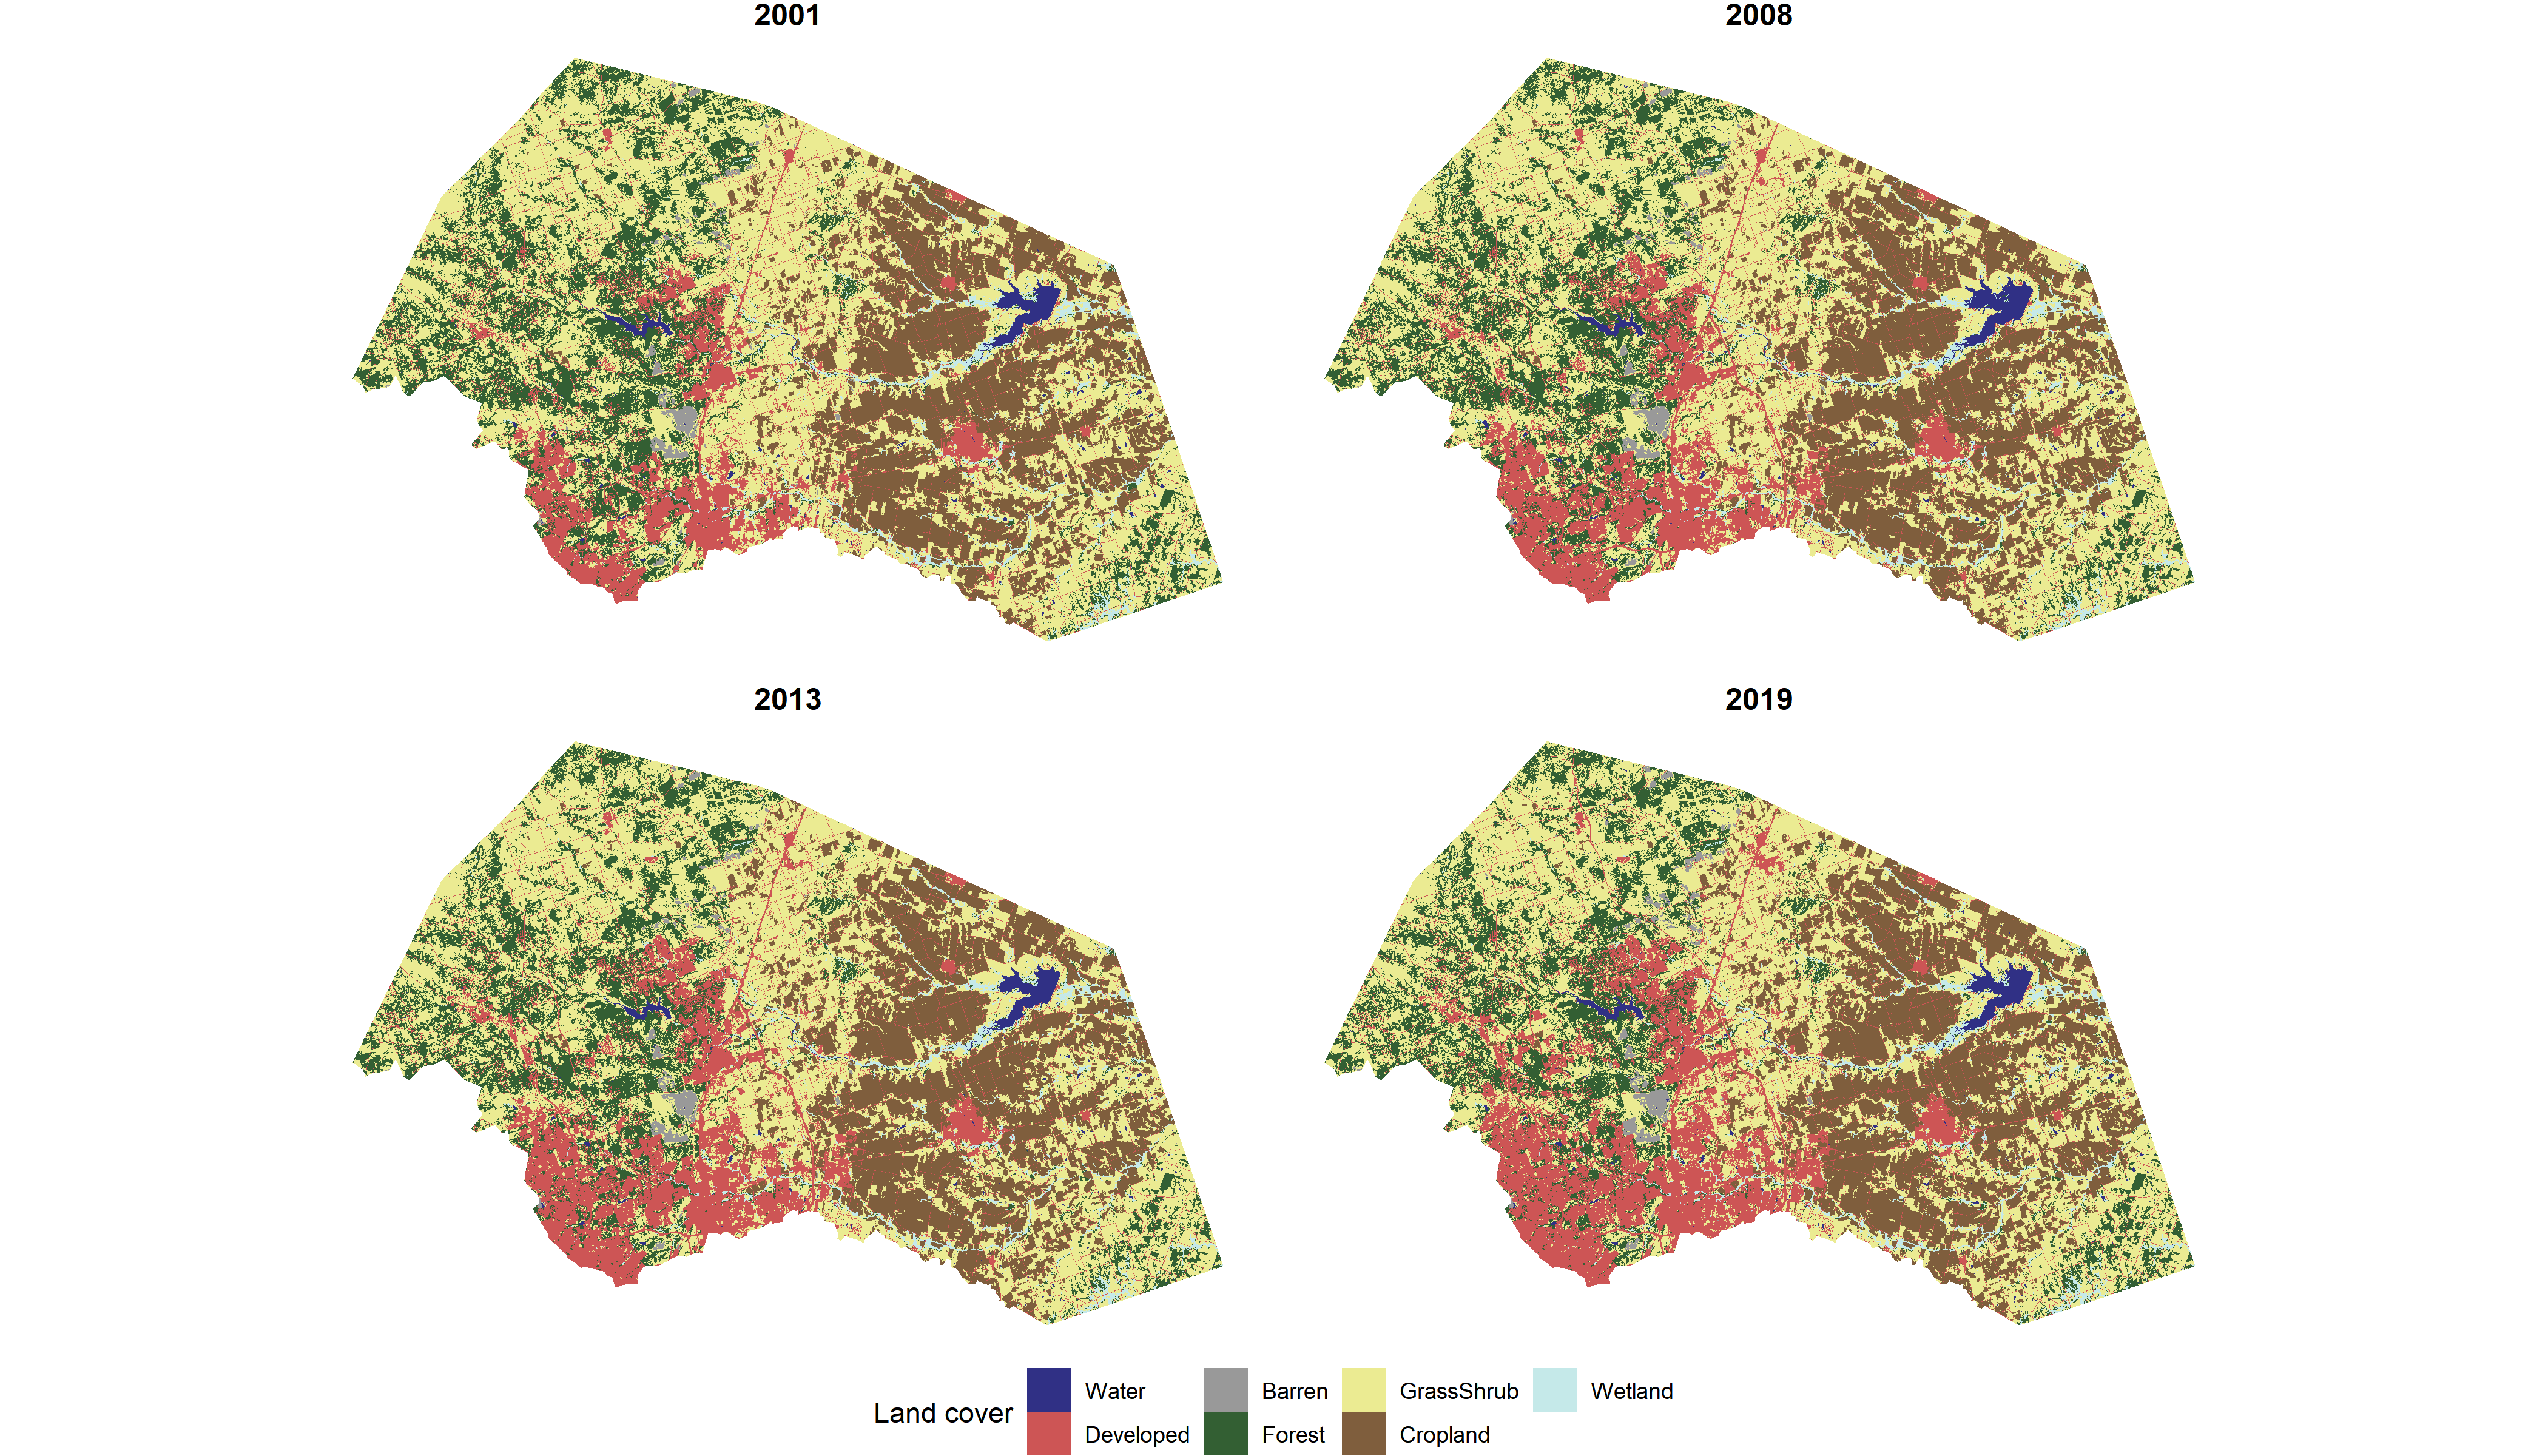
This demo turns NLCD raster data into a browser-based map for exploring how developed land, vegetation, cropland, water, and wetlands changed around the Round Rock and Williamson County area from 2001 to 2019.
What It Shows
A planning-friendly view of urban growth and landscape change.
The map simplifies NLCD categories into seven readable classes and lets viewers switch between selected years. The goal is to make raster analysis understandable to non-specialists while still showing real geospatial processing behind the scenes.
Reusable Pattern
This same approach can work for other places.
The workflow can be adapted for a city, county, watershed, property, corridor, or planning area where land-cover change matters.