Ordinary Coverage Circles
Fast visual check
Useful for seeing approximate reach, but easy to over-trust because overlap, gaps, local exposure, and real-world sound behavior stay mostly hidden.
 Tillotson
Spatial Systems
Start a Project
Tillotson
Spatial Systems
Start a Project
Outdoor Warning + Hazard Planning
Before a city or county adds another asset, Tillotson Spatial evaluates how the existing network performs, where gaps remain, and whether relocation, reconfiguration, or a new installation produces the greatest public benefit.
Know whether the next siren should be added, moved, replaced, or justified.
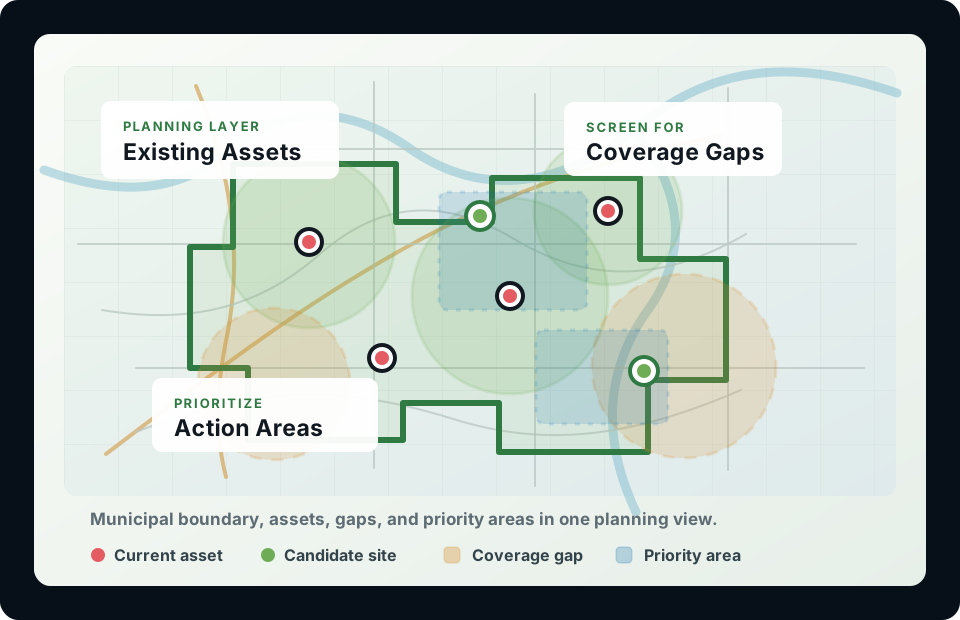
Why Modeling Matters
Simple coverage circles can show nominal reach, but they do not explain how siren models, terrain, land cover, ambient noise, weather assumptions, overlapping coverage, population patterns, and outdoor gathering places affect the whole network.
Ordinary Coverage Circles
Useful for seeing approximate reach, but easy to over-trust because overlap, gaps, local exposure, and real-world sound behavior stay mostly hidden.
Decision-Support Analysis
Combines modeled audibility, existing assets, candidate sites, population, outdoor spaces, vulnerability-adjusted coverage, budget limits, and practical constraints.
What This Solves
Many warning networks grow one purchase at a time. That can leave avoidable gaps, redundant overlap, and capital requests that are difficult to explain. This framework asks what the current system can do before more capital is spent: measure existing performance, test lower-cost moves, compare new-site options, and explain the tradeoffs in plain language.
Quantify current outdoor audibility, population reach, outdoor-space exposure, and obvious coverage gaps.
Compare keeping, moving, replacing, and adding sirens under budget, siting, and candidate-location constraints.
Turn scenario results into board, council, and grant-ready maps, tables, assumptions, and plain-language findings.
Glenpool Case Study
The case-study demo compares the existing siren network, the 2025 expansion, and modeled optimization scenarios. The point is not that every community should relocate sirens. The point is that the choice can be tested before asking for capital: does the next dollar buy more public benefit through another siren, a lower-cost relocation strategy, or a different site plan that is easier to defend in a grant, budget, or public-safety discussion?
Realized Expansion
$19,500 Reconfiguration
At the local $32,500 benchmark, optimized reconfiguration reached 83.48% population and 84.57% vulnerability-adjusted coverage while retaining the twelve-siren inventory.
The $32,500 benchmark shifted more benefit toward population and higher-need areas. Outdoor-space coverage remained above the realized expansion, but below the lower-cost outdoor-focused gains, showing how priorities affect results.
When funding rules only support new equipment, the model can rank new-site options. In this case, the new-siren-only grant scenario was useful, but still left reconfiguration value on the table.
Interactive Research Figure
Explore the complete budget-response results behind the Glenpool case study. Each point is a modeled optimization scenario from the research dataset, not an interpolated or illustrative estimate.
Web version of manuscript Figure 4. Requested caps run from the existing network through $100,000; modeled spend can be lower when the optimizer does not use the full allowance. Research is in preparation for publication.
Interactive Web Map
Toggle modeled sound layers, baseline coverage, budget scenarios, and optimized layout benchmarks inside the map.
| Scenario | Action | Population Coverage | Vulnerability-Adjusted Coverage | Outdoor-Space Coverage | Modeled Cost | Key Takeaway |
|---|---|---|---|---|---|---|
| 2024 Existing | 12 existing sirens | 52.37% | 47.45% | 43.14% | Existing system | Quantifies the starting gaps. |
| 2025 Expansion | 13 sirens, including one new site | 73.28% | 74.25% | 59.92% | $32,500 local new-siren benchmark | Improved coverage, but substantial gaps remained. |
| Lower-Cost Existing-System Reconfiguration | Existing inventory retained; selected sites reconfigured | 76.47% | 78.13% | 82.07% | $19,500 | Beat realized expansion at about $13k less. |
| Same-Budget Reconfiguration | Existing inventory retained; optimized before purchase | 83.48% | 84.57% | 75.67% | $32,500 used | Strongest benchmark return |
| New-Siren-Only Grant Scenario | Existing sirens fixed; new candidate sites only | 74.27% | 74.70% | 73.08% | $31,233 used | Useful for grant rules, but left relocation value on the table. |
Values are modeled case-study outputs from the verified reconfiguration and new-siren-only sensitivity tables. Budget rows report selected modeled spend inside the requested cap, not construction quotes. The reconfiguration rows shown here retain all existing assets as part of the active system; less-constrained optimization runs may identify an existing site as making little additional contribution to the selected objective. Relocation uses a $6,500 planning assumption; actual local costs require site-specific review.
The lesson is not that a community should never buy another siren. It is that the purchase should be sequenced after the existing network is measured and tested. In this case, a lower-cost reconfiguration outperformed a real expansion, and the same tool can show when a grant-funded new site is still the best path. That turns a capital request into a defensible comparison of where limited dollars change actual coverage.
Decision Support
The deliverable is built to help staff explain the decision, not just run a model. It can support capital planning, FEMA or hazard-mitigation grant narratives, public-safety briefings, council packets, and internal discussions about whether to add, move, replace, or hold.
Beyond Tornado Sirens
Sirens should not be treated as the whole warning message. They are an outdoor attention cue that should point people toward shelter and additional information from trusted alerting channels. The same planning workflow can help justify investments for tornadoes, severe wind, flood-prone outdoor areas, industrial corridors, large venues, and other local hazard-planning needs.
Evaluate outdoor audibility, gaps near growth areas, schools, parks, and public gathering places.
Plan alert coverage around flood-prone corridors, parks, trails, campgrounds, or isolated hazard zones.
Compare warning reach for outdoor workers, nearby neighborhoods, staging areas, or evacuation routes.
Support preparedness planning for ballfields, festivals, school facilities, sports complexes, and parks.
Service Options
These can be scoped as a quick planning review, a defensible report, a board-ready capital planning package, or a deeper technical model.
Package 1
Map the current system, summarize likely coverage, and identify obvious gaps or redundant overlap.
Package 2
Use terrain, land cover, ambient noise, siren characteristics, and weather assumptions to model outdoor audibility.
Package 3
Combine modeled coverage with optimization to compare relocation, replacement, expansion, and budget scenarios.
Package 4
When the decision is specifically where to place the next new siren, rank candidate sites against local priorities.
Package 5
Adapt the coverage analysis to tornadoes, flood-prone locations, hazmat corridors, venues, or outdoor facilities.
Package 6
Turn the technical work into clear maps, tables, and narrative that support public-safety funding decisions.
Workflow
The technical model is only useful if the final product is easy to understand, defend, and update.
Collect siren locations, models, alerting purpose, boundaries, population, outdoor areas, and local constraints.
Estimate coverage using the right level of detail, from planning zones to acoustic sound propagation.
Compare move, add, replace, and new-placement scenarios under realistic budget and siting assumptions.
Deliver maps, dashboards, metrics, and plain-language recommendations for staff and public discussion.
Start With the Decision
Send the location, the decision you are facing, and any existing siren, hazard, population, or facility data you already have.